AI helps multi-site restaurant groups see issues fast by checking every site's numbers each day and pointing you to the few that are out of line. You don't have to read every report for every site. You go straight to the site, the number and the menu item that need attention, and ask the next question in plain English.
Every multi-site operator knows the feeling: "14 sites. You can't be everywhere." Restaurant analytics software should reply: We are. This guide covers the numbers that show issues first, how AI surfaces them, and a short routine for checking them each week.
What does "seeing issues fast" mean for a multi-site group?
Seeing issues fast means finding the site that's out of line within a day, not at month-end. It's also called exception-based reporting: instead of reviewing every number at every site, you look at the exceptions. That means the site whose waste jumped, the menu item whose margin slipped, or the store where discounts doubled.
In the US this is often called multi-unit restaurant analytics. The idea is the same.
Why issues hide in multi-site groups
The more sites you run, the easier it is for one bad week to disappear into a good group total.
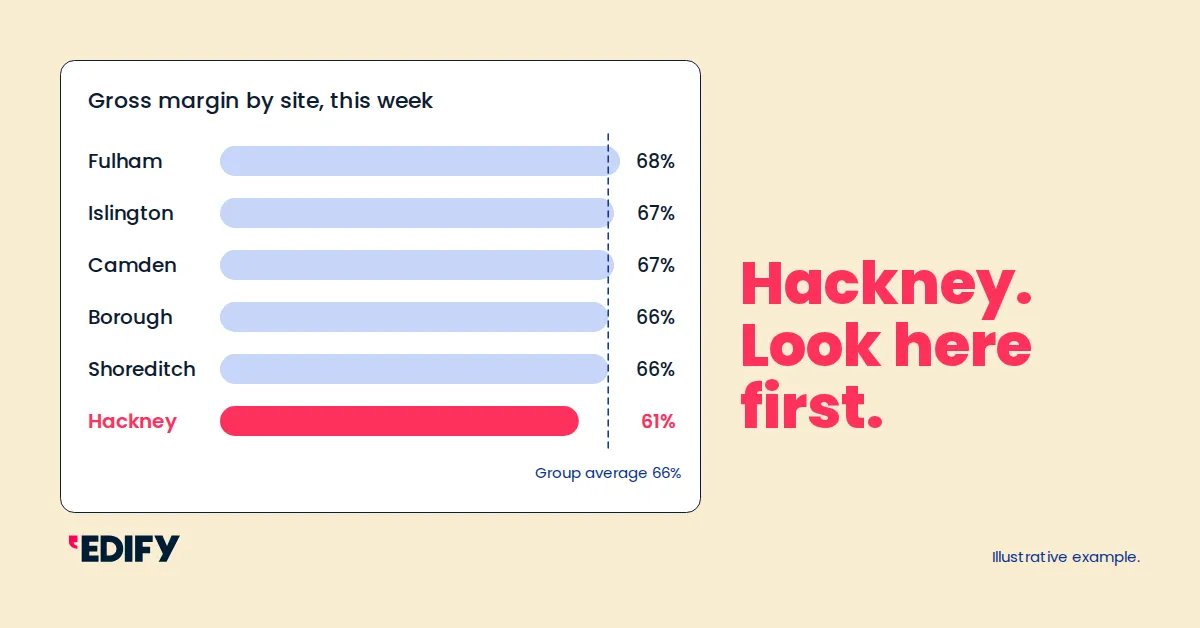
- Averages hide outliers. A group gross margin of 66% can sit on top of one site at 61%.
- Every site reports differently, so comparing them takes a spreadsheet and an afternoon.
- Month-end is too late. By the time the P&L lands, the waste has been binned and the discounts have been given.
- Area managers can't be everywhere. They visit the sites they're worried about, not always the ones that need them.
- Reports answer one question at a time. Every follow-up question means another export.
The eight numbers that show issues first
These are the numbers worth checking across every site, every day. A change in any of them doesn't tell you the cause. It tells you where to look.
| Number | What a change can signal | A question to ask |
|---|---|---|
| Sales | Footfall, availability or opening-hours problems | Which sites are down on the same day last week? |
| Gross margin | Supplier price rises, portioning, or a shift in what's selling | Which site's gross margin dropped most this week? |
| Operational profit | Costs growing faster than sales | Which sites made less profit than last week on similar sales? |
| Cost of sales | Price changes, over-ordering or stock going missing | Where is cost of sales highest as a % of sales? |
| Average transaction value (ATV) | Fewer add-ons, or upselling slipping | Which sites' ATV fell this week? |
| Discounts | Promotions running long, or discounts used without approval | Where did discounts rise the most? |
| Waste | Over-production, short shelf life, or forecasts that are off | Which site's waste is well above its usual level? |
| Menu profitability by item | Items whose costs have changed but whose prices haven't | Which items made the least margin at each site? |
Five ways AI helps you see issues fast
1. One daily view across every site
"Fulham's at 68% GP and Hackney's at 61%. Same menu. Same prices."
Edify brings sales, gross margin, operational profit, cost of sales, ATV, discounts and waste for every site into one place, updated daily. You start each morning with yesterday's picture for the whole group, not one site at a time.
2. Sites compared side by side
A number only means something next to another number. Edify puts your sites side by side, so the one that's out of line stands out from the group instead of disappearing into the average.
3. Custom AI Insights for the things you care about
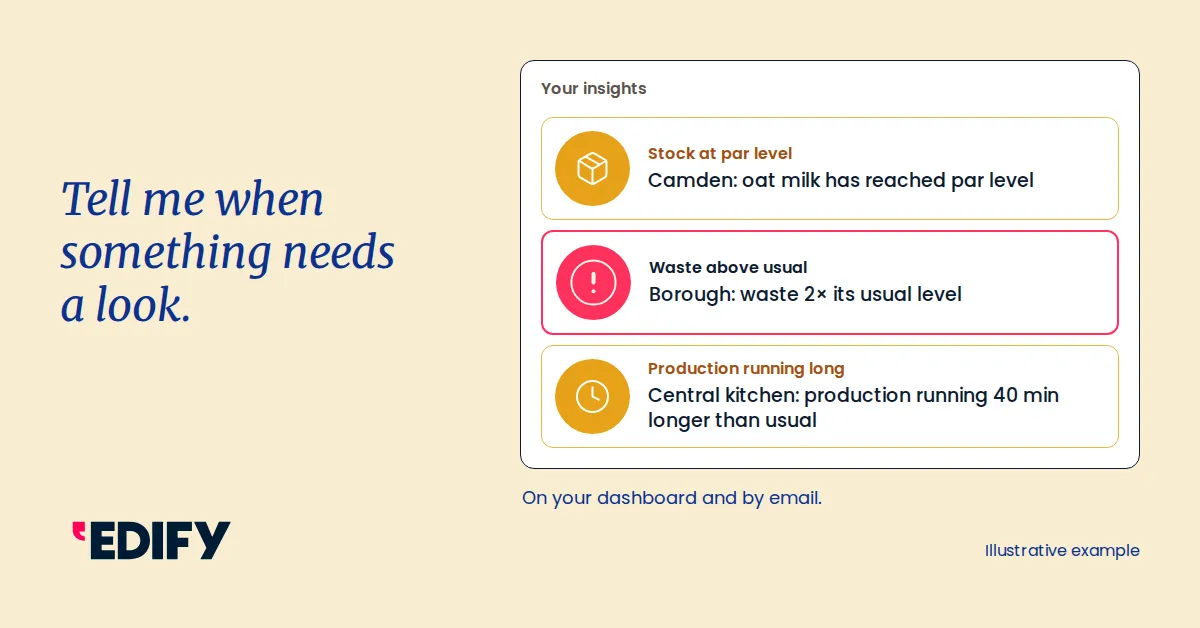
Every group worries about different things. With Custom AI Insights, you choose what you want Edify to watch, and it brings the answer to you on your dashboard and by email. For example:
- Sites where stock has reached its par level
- Sites where waste is well above its usual level
- Production that's taking longer than usual
You don't need to go looking. When something needs a look, it finds you.
4. Ask Edify the next question
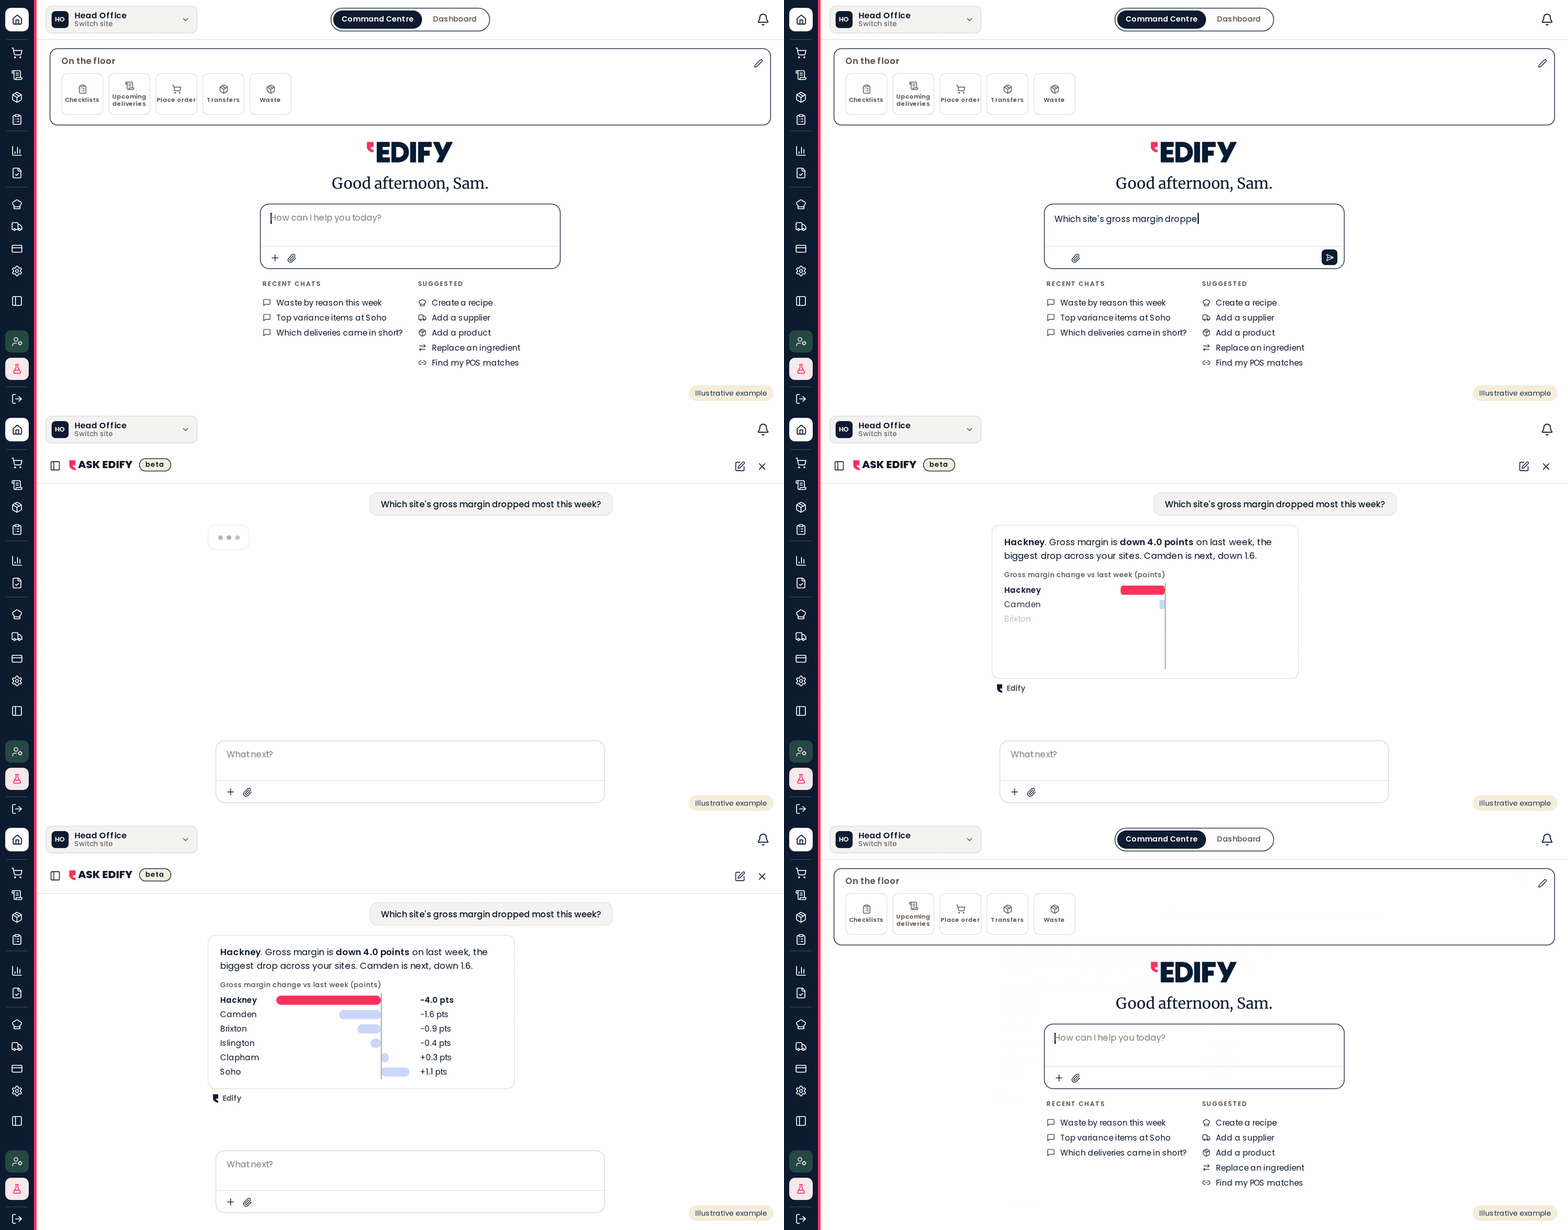
"Which site's gross margin dropped most this week?"
The first number rarely tells the whole story. Ask Edify lets you ask questions across all your sites in plain English and get the answer back, with a simple chart when a picture helps. You go from "something's wrong" to "it's this site" without building a report.
5. Drill down from site to menu item
"Supplier prices are up. Again. Where's it hurting us?" → 3 ingredients. 8 dishes. 2 sites to look at first.
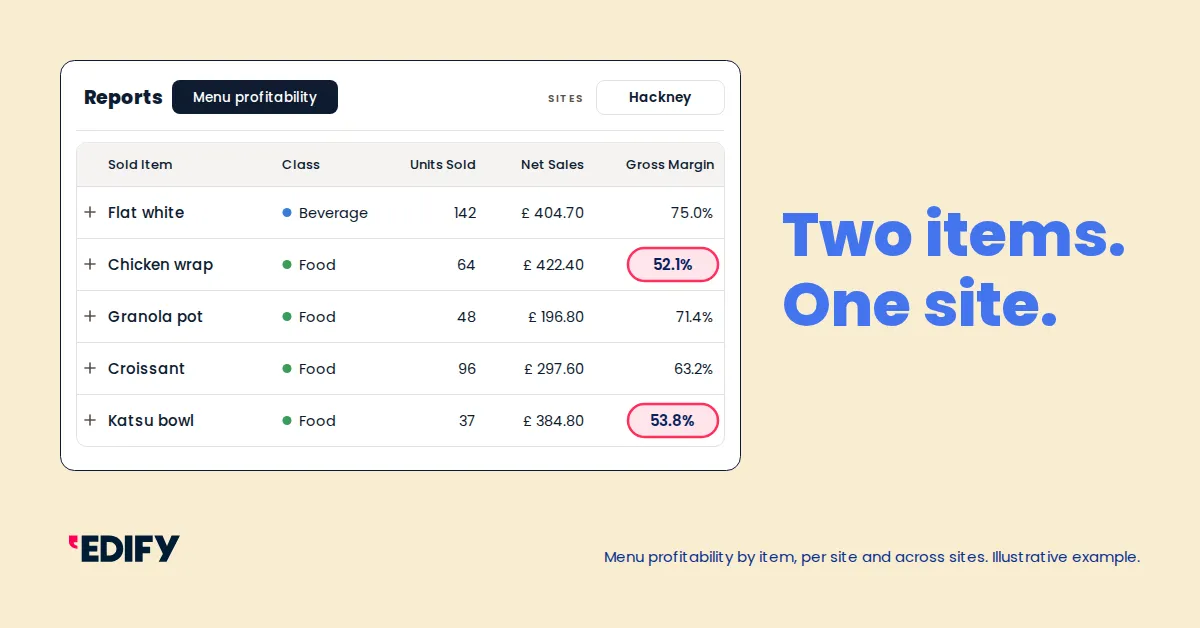
Once you know which site, you need to know which item. Edify shows menu profitability by item, for each site and compared across sites. It also shows stock variance by product, so you can see which items are costing more than they should.
What AI still leaves to your team
Edify takes a Human-First AI approach. It reads the numbers, compares the sites and surfaces what needs a look. People decide what to do about it.
- It shows where, not why. A drop in gross margin points you to a site and an item. The site team knows whether it was portioning, a supplier or a busy weekend.
- It updates daily, not live. It's built for spotting problems day by day, not for watching a single lunch service.
- It's only as good as the data underneath. A connected POS, accepted deliveries, logged waste and regular stocktakes keep the numbers trustworthy.
Other approaches vs Edify's approach
| Approach | How you see issues | Comparing sites | Asking follow-up questions | Alerts |
|---|---|---|---|---|
| Spreadsheets | Weekly or monthly, once someone builds them | Manual copy and paste | Build another tab | None |
| POS reports | Sales only, usually one site at a time | Limited | Fixed reports | Rarely |
| Generic BI dashboards | Whatever was configured at set-up | Possible, with an analyst's help | Request a new report | Threshold rules someone has to maintain |
| Edify | Sales, margin, profit, cost of sales, ATV, discounts and waste, updated daily | Side by side across every site, down to menu item | Ask Edify in plain English, across sites | Custom AI Insights on the dashboard and by email |
Comparing specific platforms? See our platform comparisons.
How Edify helps
Edify is an operating intelligence platform for multi-site restaurant, QSR and coffee groups. It connects your POS, suppliers and finance data, so every site's performance sits in one place.
For seeing issues fast, Edify gives you:
- A daily view of every site: sales, gross margin, operational profit, cost of sales, ATV, discounts and waste.
- Side-by-side site comparison, so outliers stand out from the group total.
- Menu profitability by item, per site and across sites.
- Custom AI Insights, which watch the things you choose and alert you on the dashboard and by email.
- Ask Edify, for plain-English questions across all your sites, with simple charts.
Edify is used by hospitality groups including Pret A Manger, Dunkin', Watch House, Soho Coffee, Yolk and Urban Baristas.
When to use Edify: when you run several sites, issues only show up at month-end, and your area managers spend more time building reports than visiting the sites that need them. See features and pricing.
Want to see your sites side by side?
Frequently asked questions
What is restaurant analytics software?
Restaurant analytics software brings sales, cost and operational data from your restaurants into one place, so you can see performance and spot problems. For multi-site groups, Edify compares every site daily and surfaces the ones that are out of line.
How does AI help multi-site restaurants see issues faster?
AI checks every site's numbers each day and points you to the exceptions, such as a site whose waste is well above its usual level. In Edify, Custom AI Insights send these to your dashboard and by email, and Ask Edify answers follow-up questions in plain English.
Which metrics should multi-site restaurant groups check daily?
Sales, gross margin, operational profit, cost of sales, average transaction value (ATV), discounts and waste, compared across sites. Menu profitability by item helps you find which dishes are behind a margin change.
How often does Edify update its data?
Edify updates daily. It's built for spotting problems across sites day by day, rather than for watching a single service live.
Can I compare sites with Ask Edify?
Yes. Ask Edify answers questions across all your sites in plain English, such as "Which site's gross margin dropped most this week?", and can draw simple charts.
What is exception-based reporting in restaurants?
Exception-based reporting means looking only at the sites and numbers that are out of line, instead of reviewing every report for every site. It helps area managers and ops teams spend their time where it's needed.
